Robert J. Hatton

Business Intelligence Developer & Author

About Robert Hatton

A fundamental truth for SQL Server’s optimizer

June 4, 2016 By Robert Hatton 1 Comment

Facebooktwittergoogle_plusredditpinterestlinkedintumblrmail
Table joins vs. query plans

Table joins vs. query plans

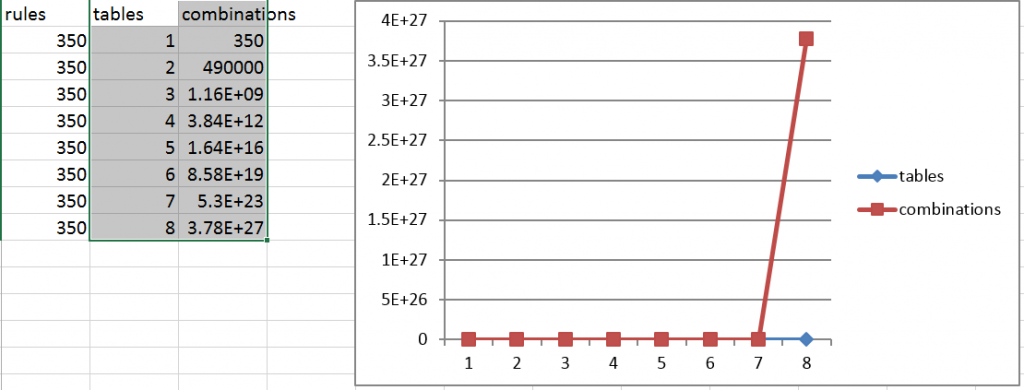
SQL Server uses an optimizer to figure out how to retrieve data and process a query. For every table, it evaluates roughly 350 different rules. It occurred to me that this would lead to exponential growth in the number of potential query plans. The following formula is one way to think about the problem of increasing the potential number of query plans as the number of tables in a query increases:

(t*350)^t

In the above query, ‘t’ represents the number of tables. It’s obvious that the optimizer would need to evaluate 350 rules per table (hence t*350). That’s actually not always true as the optimizer knows how to take some shortcuts, but it’s a reasonable number for this exercise. What’s less obvious is that the order that the optimizer evaluates rules for tables increases exponentially with the number of tables. This is expressed by the part of the formula that raises the result of the rules evaluation for each table to the power of the number of tables (^t). It turns out that this is an ‘NP complete’ problem.

What this means in the real world is that it quickly becomes less likely that  SQL Server’s optimizer will find the optimal execution plan once you have more than 6 tables in a join. That doesn’t mean that performance will always be awful with more that 6 tables in a join. It just means that it becomes much more likely. Once you encounter performance problems with this many tables in a query, there may be no other way to improve performance than to reduce the number of tables joined.
Picture a database

June 4, 2016 By Robert Hatton Leave a Comment

Facebooktwittergoogle_plusredditpinterestlinkedintumblrmail

When you walk into a new project, it can be a challenge to build a mental image of what’s going on quickly. I could spend an hour just talking about how to get organized quickly. Instead of blathering on, here’s a script to query the system tables of the database to document it’s structure and then sample the actual data to help you see what’s actually in there.

The script will output the following columns: TableName, ColumnName, recordCnt, distinctCnt, nonNullCnt, NullCnt, fldSample. The general idea is to show you a list of the tables and columns followed by some counts of how many distinct values each table has along with how many records are null (or not). The real value is in seeing a sample of the values in each column (it’s in the fldSample column) . The script is set to limit the sample data to 200 characters, but that’s easy to change.
In any event, here’s the script:

USE [Datawarehouse]

GO

declare @tbl varchar(50)
declare @col varchar(50)
declare @sqlStmt varchar(700)
declare @val varchar(100)
declare @fldSample varchar(200)
set @val = ”
set @fldSample = ”

–Recreate the profile table
IF EXISTS (SELECT * FROM sys.objects WHERE object_id = OBJECT_ID(N'[dbo].[dbProfile]’) AND type in (N’U’))
DROP TABLE [dbo].[dbProfile]
CREATE TABLE [dbo].[dbProfile](
[TableName] [varchar](50) NOT NULL,
[ColumnName] [varchar](50) NOT NULL,
[recordCnt] [int] NULL,
[distinctCnt] [int] NULL,
[nonNullCnt] [int] NULL,
[NullCnt] [int] NULL,
[fldSample] varchar(300)
) ON [PRIMARY]

declare dbSchema cursor for
SELECT t.name AS table_name,
c.name AS column_name
FROM sys.tables AS t
INNER JOIN sys.columns c ON t.OBJECT_ID = c.OBJECT_ID
ORDER BY table_name

open dbSchema
fetch next from dbSchema into @tbl, @col
while @@FETCH_STATUS = 0
begin

set @sqlStmt = ‘declare fldList cursor for select distinct ‘ + @col + ‘ from ‘ + @tbl
EXEC (@sqlStmt)
set @fldSample = ”
open fldList

fetch next from fldList into @val

while @@FETCH_STATUS = 0
begin
set @fldSample = @fldSample + rtrim(ltrim(@val)) + ‘, ‘
fetch next from fldList into @val
end

close fldList
deallocate fldList

set @sqlStmt = ‘insert into dbProfile (TableName, ColumnName, recordCnt, distinctCnt, nonNullCnt, nullCnt, fldSample) ‘
set @sqlStmt = @sqlStmt +’select ”’+@tbl+”’ as TableName ,”’+@col+”’ as ColumnName, ‘
set @sqlStmt = @sqlStmt +’count(*) as recordCnt, ‘
set @sqlStmt = @sqlStmt +’count(distinct [‘+@col+’]) as distinctCnt, ‘
set @sqlStmt = @sqlStmt +’sum(case len(rtrim([‘+@col+’])) when 0 then 0 else 1 end) as nonNullCnt, ‘
set @sqlStmt = @sqlStmt +’sum(case len(rtrim([‘+@col+’])) when 0 then 1 else 0 end) as NullCnt, ‘
set @sqlStmt = @sqlStmt +  ”” + left(@fldSample,200) + ””
set @sqlStmt = @sqlStmt +’ from ‘ + @tbl
–select @sqlStmt
begin try
EXEC (@sqlStmt)
end try
begin catch
print(@sqlStmt)
end catch

fetch next from dbSchema into @tbl, @col
end
close dbSchema
deallocate dbSchema
select * from dbProfile

Crystal Reports

October 16, 2013 By Robert Hatton Leave a Comment

Facebooktwittergoogle_plusredditpinterestlinkedintumblrmail

I just did a project for a client who has an accounting package that uses Crystal Reports. He was having problems with orphaned footers. Much to my surprise, it seems that this is a common problem with Crystal Reports. It was easy to find forums where people were wrestling with this issue. Folks were discussing all kinds of different solutions, but I didn’t see any mention of putting a simple BASIC statement in the ‘Page Before’ event of the Detail section to limit the number of rows:

shared numbervar nRow;
if (nRow < 30) then
(nRow := nRow + 1;
false)
else
(nRow := 0;
true)
It seems to work pretty well. I have to say, though, that I don’t regret not having used Crystal Reports for several years. It’s pretty clunky.


SQL Saturday was great!

September 23, 2013 By Robert Hatton Leave a Comment

Facebooktwittergoogle_plusredditpinterestlinkedintumblrmail
SQL Saturday San Diego 2012

SQL Saturday San Diego 2013

The SQL Saturday last weekend was a great meeting! As usual, there was a lot of great information to absorb. Paul Turley’s presentations on Tablular Models and Visualization Choices were particularly good. I hadn’t gone to any of the non-technical presentations in the past, but I went to the ’10 Things I Hate About Interviewing With You’ session and found it to be worthwhile.

My ‘Designing for Analysis’ presentation went great. It was standing room only and the audience was actively engaged the whole time. This was the second time I’ve presented on this topic. Thanks to feedback from the first presentation, I made some changes that made a huge difference this time. Feedback from this session leads me to believe that I should split this presentation into a  beginner version and a deeper dive.

All in all, though, it was a wonderful weekend!

Speaking at SQL Saturday this weekend!

September 19, 2013 By Robert Hatton Leave a Comment

Facebooktwittergoogle_plusredditpinterestlinkedintumblrmail

I’ll be giving a presentation on “Designing for Analysis” at the SQL Saturday in San Diego this weekend. It’ll cover how to separate information into Facts and Dimensions and organize it into a Star Schema. Of course, that means I’ll have to explain what a Star Schema is and why it’s cool! The part I’m interested in seeing how people respond to is the description of how to organize the ETL (Extract / Transform / Load) to make everything work!

Here’s a PDF of the presentation:FactsAndDimensions

Incremental extracts

August 12, 2013 By Robert Hatton Leave a Comment

Facebooktwittergoogle_plusredditpinterestlinkedintumblrmail

This is going to be a long post, but I see folks working way harder than needed to extract data for BI systems. Given the large quantities of data available in source systems, it’s obvious that it is not practical to transfer all of the data to the Business Intelligence solution on each extract. Incremental extracts are needed to cut quantity of data transferred down to a manageable level.

An incremental extract is simply the product of a program which will pull data from a source system for a specified date range.

It might be tempting to create an extract program which simply extracts data from the prior day. In actual practice, this often an undesirable approach. It is not unusual to encounter a situation where a given day or range of days worth of data needs to be re-extracted.

A much better way to implement an extract program is to provide the start and end dates at run time. This can be done by providing them as command line arguments when the extract program is invoked or by having the extract program pick the start and end date up from a database table or environmental variables.

When extract programs are designed to use start and end dates that are provided at run time, it is possible to query the existing data repository for the record loaded from that extract with the most recent date. This yields an extract facility which is, to a great degree, adaptive to the needs of the database. If a network failure prevents the data transfer for an entire day, no manual intervention is necessary. The next day when the extract runs it will extract data for two days instead of one. If you have to delete a week’s worth of data because of a problem with a source system then next execution of the extract will retrieve the appropriate amount of data.

While there are several ways to implement this type of extract, one way that is commonly supported is to create the extract program so that is gets the start and end date as command line arguments. Command line scripts can then be used to find the appropriate start and end dates then build the command line to start the program.

Using a Windows / SQL server environment as an example, the following SQL statement could be used to create a command line to start an extract program that would pull whatever data from a sales_facts table in the source system that is not currently in the data warehouse:

set nocount on

select ‘salesExtract ‘

+ (select convert(char(10), max(timestamp), 101) from sales_facts) + ‘ ‘

+ (select convert(char(10), dateadd(d, -1, getdate()), 101))


The above query would create the following output:

salesExtract 08/07/2013 08/08/2013

Assuming the above query was saved in a file named “salesExtract.sql” another batch file could be used to:

  1. Create a batch file which would start the extract program
  2. Start the extract program (which would create a text file in the landing area)
  3. Delete the batch file

The following script would be saved as a batch file named “salesExtract.bat”, and would perform the steps outlined above.

sqlcmd -h -1 -s “localhost” -d “biDB” -i “salesExtract.sql” -o “salesExtractCurrent.bat” salesExtractCurrent.bat

del salesExtractCurrent.bat

In actual use, a job scheduler would be used to start the “salesExtract.bat” batch file, which would use the “salesExtract.sql” file to create a temporary batch file (“salesExtractCurrent”) that it would then execute. Once the extract was created in the landing zone, the salesExtractCurrent batch file would be deleted.

As previously mentioned, there are several ways to create an extract facility that will retrieve all of the data needed to bring the data repository current. The above example illustrates one approach that works in a variety of environments. However it is implemented, making the extract facility do more that simply retrieve the prior day’s activity will make the finished solution much more robust.

Someone in the government doing really cool work

July 12, 2013 By Robert Hatton Leave a Comment

Facebooktwittergoogle_plusredditpinterestlinkedintumblrmail

Say what you will about ‘Obamacare’, what’s going on behind the scenes (in terms of tech) is totally cool. It’s kind of a long article, but well worth the read.

http://www.infoworld.com/d/consumerization-of-it/the-savvy-tech-strategy-behind-obamacare-222251

Of course, it all depends on folks actually caring about health information. If we’re all just sheep, it won’t turn out well.

Finding stuff in SQL Server

July 8, 2013 By Robert Hatton Leave a Comment

Facebooktwittergoogle_plusredditpinterestlinkedintumblrmail

Starting at a new client usually means some exploring in databases to figure out how things work. The system tables can be used to find where a text string is used in stored procedures or column names. The following queries will find where a specific string is used. Just use the database of interest, set a value for the @searchStr variable, and run the query!

declare @searchStr as varchar(50)
set @searchStr = ‘%categoryID%’

–Find string in proc
select distinct OBJECT_NAME(id)
from syscomments
where OBJECTPROPERTY(id, ‘IsProcedure’) = 1
and [text] like @searchStr
order by OBJECT_NAME(id)

–Find table and column by name
SELECT t.name AS table_name,
SCHEMA_NAME(schema_id) AS schema_name,
c.name AS column_name
FROM sys.tables AS t
INNER JOIN sys.columns c ON t.OBJECT_ID = c.OBJECT_ID
WHERE c.name LIKE @searchStr
ORDER BY schema_name, table_name;

Reporting Services Subscriptions (without the Enterprise server)

May 3, 2013 By Robert Hatton Leave a Comment

Facebooktwittergoogle_plusredditpinterestlinkedintumblrmail

One of the truly potent features of the Enterprise version of Microsoft’s Reporting Services is the ability to run data driven subscriptions. This supports the ability, for example, to create and email a sales report to every store in a retail chain every morning without human intervention. For an organization that’s widely distributed, this kind of thing is a big deal! Unfortunately, this is a feature that is limited to the Enterprise version of SQL Server (which is a lot more expensive than the Standard version).

I worked at a client in the past that needed this data driven subscription capability, but wasn’t prepared to pay for the Enterprise version on their database servers. So we (Andy Warren and myself) built our own data driven subscriptions! Our client kindly agreed to let us share the code:

ReportSubscriptions

The link is to a zip file which contains some documentation, some TSQL scripts and a .NET project. The general idea is to set up a database which defines subscriptions and then use .NET to create an instance of SSRS which creates and distributes the report. It worked great! In some ways, it works better than the Enterprise version (better error recovery).

Enjoy!

The server side of Reporting Services

May 3, 2013 By Robert Hatton Leave a Comment

Facebooktwittergoogle_plusredditpinterestlinkedintumblrmail

Nearly all of the presentations concerning SQL Server Reporting Services at the SQL Saturday conferences are about how to design reports. This one is a bit different, it’s about how to organize things on the server side.

The two most important points are to create a ‘shared data sources’ directory and a ‘linked reports’ directory. Make sure all developers use the same shared data sources and ALWAYS deploy into the linked reports directory using the same name the developer used. Doing so will help keep your SSRS server from becoming a mess.

The most interesting (though perhaps not most important) topic is the ReportServer database and how it can be used to create a Report of Reports. It’s a great way to untangle a SSRS server that’s a mess.

ReportingServicesServer

Enjoy!

Next Page »

Follow Me

rss

Database Spelunking

Spelunking, for those who don’t know is exploring caves. In some ways, that’s what it’s like to find your way around in databases in some organizations. It’s especially difficult without a flashlight. This PowerPoint presentation will provide some tips, techniques, and several scripts that can help shed light on your data cavern. The attached ZIP […]

SQL Style presentation

Thanks to all who joined in the SQL Style presentation at the Tampa SQL Saturday. It was great to have folks involved during a presentation. It doesn’t look like I can attach the presentation, but it’s available on the SQL Saturday website. The queries are right here: –Example Queries use Fruit go select * from […]

Categories

Copyright © 2025 Robert J Hatton